Per Cent
Age Group |
Singapore Residents |
Singapore Citizens |
||
|
1990 |
2000 |
1990 |
2000 |
|
Males |
|
|
|
|
20 – 24 |
94.2 |
95.2 |
94.1 |
95.4 |
25 – 29 |
64.1 |
64.2 |
64.0 |
66.4 |
30 – 34 |
34.0 |
30.7 |
33.9 |
33.3 |
35 – 39 |
18.1 |
19.7 |
17.8 |
21.5 |
40 – 44 |
10.9 |
14.8 |
10.4 |
15.5 |
|
|
|
|
|
|
Females |
|
|
|
|
20 – 24 |
78.5 |
83.8 |
79.0 |
86.6 |
25 – 29 |
39.3 |
40.2 |
39.6 |
45.5 |
30 – 34 |
20.9 |
19.5 |
20.9 |
21.9 |
35 – 39 |
14.8 |
15.1 |
14.7 |
16.2 |
40 – 44 |
11.5 |
13.6 |
11.4 |
14.1 |
|
|
|
|
|
|
High Proportion Unmarried among
Less Educated Males and Better Educated Females
Singlehood was more prevalent among citizen males with below secondary qualification and graduate citizen females. At age 40–44 years, 21 per cent of the males with below secondary qualifications were single in 2000, as compared with only 9 per cent of the graduate males (Table 3). In contrast, 27 per cent of the older graduate females were single, as compared to 9 per cent of the less educated females in the same age group.
Compared with 1990, singlehood rates among the citizen males had increased generally across all education levels. Those with below secondary qualification had the largest increase in singlehood rate in the last decade – by 9 percentage points. For the citizen females, the increases occurred mainly among the graduates and those with below secondary qualification. Singlehood rates had declined for the secondary and post-secondary females.
|
TABLE 3 |
PROPORTION SINGLE AMONG MALE AND FEMALE CITIZENS BY AGE GROUP AND HIGHEST QUALIFICATION ATTAINED |
Per Cent
Highest Qualification Attained |
30–34 |
35–39 |
40–44 |
|||
|
1990 |
2000 |
1990 |
2000 |
1990 |
2000 |
|
Males |
|
|
|
|
|
|
Below Secondary |
37.2 |
41.0 |
21.0 |
29.2 |
12.3 |
21.1 |
Secondary |
31.4 |
30.4 |
15.2 |
18.3 |
7.9 |
13.8 |
Post Secondary |
29.2 |
29.5 |
13.2 |
16.0 |
7.9 |
9.8 |
University |
31.2 |
33.1 |
12.4 |
17.4 |
6.1 |
8.6 |
|
|
|
|
|
|
|
|
Females |
|
|
|
|
|
|
Below Secondary |
14.9 |
15.6 |
10.4 |
11.1 |
8.0 |
9.1 |
Secondary |
23.6 |
18.4 |
19.0 |
14.5 |
17.6 |
14.8 |
Post Secondary |
30.6 |
24.4 |
24.7 |
21.4 |
20.9 |
20.4 |
University |
33.3 |
32.8 |
27.3 |
29.1 |
24.0 |
26.7 |
|
|
|
|
|
|
|
|
Ethnic Differentials in Singlehood Trends
Among the older citizen males aged 35–44 years, Chinese with below secondary qualification had the highest singlehood rate – 28 per cent in 2000 compared with 14–15 per cent for the Malays and Indians (Table 4). For the university-educated males, the proportion single was higher among the Indians (16 per cent) than the Chinese (14 per cent) and Malays (9.1 per cent). Compared with 1990, the singlehood rate for the older males had increased across all educational levels for all the three main ethnic groups.
The Chinese had the highest singlehood rate for the older females. Some 29 per cent of graduate Chinese females aged 35–44 years were single in 2000, compared with 25 per cent of the Malays and 14 per cent of the Indians. Between 1990 and 2000, the graduate singlehood rate had increased for the Chinese and Malays but not the Indians. For older females with secondary and post secondary qualifications, the proportion single declined over the decade for all the three main ethnic groups.
|
TABLE 4 |
PROPORTION SINGLE AMONG MALE AND FEMALE CITIZENS AGED 35–44 BY HIGHEST QUALIFICATION ATTAINED AND ETHNIC GROUP |
Per Cent
Highest Qualification Attained |
Chinese |
Malays |
Indians |
|||
|
1990 |
2000 |
1990 |
2000 |
1990 |
2000 |
|
Males |
|
|
|
|
|
|
Below Secondary |
18.3 |
28.2 |
10.5 |
13.7 |
11.8 |
15.2 |
Secondary |
13.3 |
18.4 |
7.1 |
9.0 |
9.3 |
10.9 |
Post Secondary |
11.3 |
13.9 |
6.3 |
7.7 |
10.9 |
10.6 |
University |
9.4 |
13.5 |
8.2 |
9.1 |
13.9 |
15.7 |
|
|
|
|
|
|
|
|
Females |
|
|
|
|
|
|
Below Secondary |
9.6 |
10.8 |
7.4 |
7.4 |
8.4 |
8.3 |
Secondary |
19.5 |
16.5 |
12.0 |
8.2 |
14.9 |
9.9 |
Post Secondary |
23.8 |
22.1 |
17.2 |
13.8 |
21.5 |
14.9 |
University |
26.7 |
29.2 |
23.1 |
25.4 |
20.6 |
14.1 |
|
|
|
|
|
|
|
|
NUMBER OF CHILDREN BORN
Smaller Family Size
The average family size had become smaller. In 2000, each ever-married female had 2.5 children on average, compared with 2.8 children in 1990. The decline in family size occurred for ever-married females across all age groups. Chart 1 shows the shifting of the graphs towards the left, indicating fewer children born to each birth cohort of the females. The mean number of children born had declined from 3.9 for the pre-1950 cohort to 1.8 for the 1961 to 1970 cohort.
|
|
RESIDENT EVER-MARRIED FEMALES AGED 15 YEARS AND OVER BY BIRTH COHORT AND NUMBER OF CHILDREN BORN |
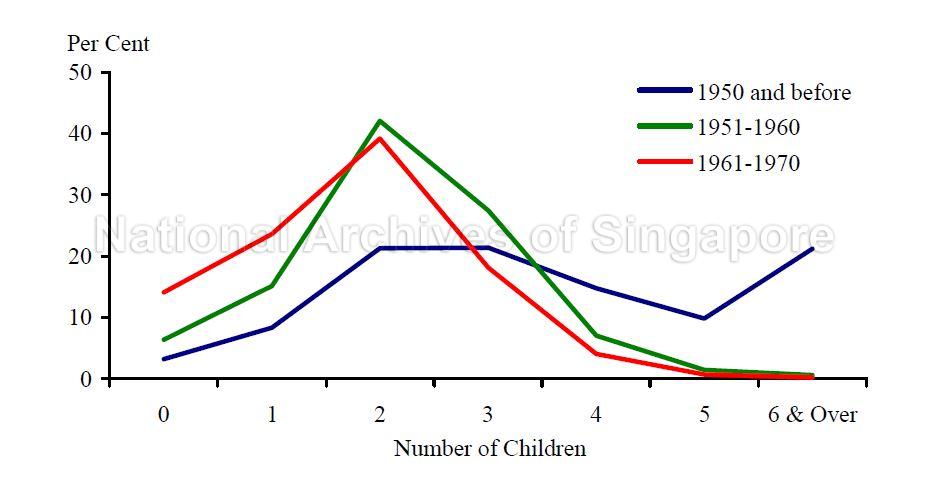 CHART 1
Older Age at First Marriage
The decline in family size was associated with the trend towards delay in marriage. More females were marrying later than before. The delay in marriage occurred for females at all levels of qualification and all the main ethnic groups (Table 5). The increase in marriage age was most marked for females with secondary and lower qualifications. Malay and Indian females had the largest increase in marriage age between the period 1960 or earlier and 1991–2000 – 7 years as compared with 6 years for Chinese females.
|
TABLE 5 |
MEAN AGE AT FIRST MARRIAGE BY YEAR OF MARRIAGE OF RESIDENT EVER-MARRIED FEMALES |
Years
|
|
1960 |
1961–1970 |
1971–1980 |
1981–1990 |
1991–2000 |
|
|
|
|
|
|
|
Ethnic Group |
|
|
|
|
|
Chinese |
20.7 |
23.3 |
24.3 |
26.1 |
26.9 |
Malays |
17.7 |
19.9 |
21.7 |
23.5 |
24.8 |
Indians |
18.0 |
20.3 |
22.1 |
24.0 |
25.3 |
Others |
21.1 |
23.2 |
23.8 |
25.7 |
27.0 |
|
|
|
|
|
|
|
Qualification |
|
|
|
|
|
Below Secondary |
20.0 |
22.4 |
23.6 |
25.3 |
26.9 |
Secondary |
22.0 |
23.2 |
23.8 |
25.3 |
26.3 |
Post Secondary |
23.7 |
24.6 |
24.6 |
25.9 |
26.3 |
University |
24.5 |
25.3 |
25.2 |
26.3 |
26.9 |
|
|
|
|
|
|
|
More Women with No Children or Only One Child
Among the younger age groups, the proportion childless had increased significantly. Almost half of the ever-married females below 30 years of age and 14 per cent of those aged 30–39 had yet to have children in 2000 (Table 6). The corresponding proportions in 1990 were 38 per cent and 11 per cent. The rise was due to the delays in marriage and childbearing. However, the proportion of childless families at the end of the reproductive span was still low, but on a rising trend.
One-child families were getting more common. Among ever-married females aged 30–39 years, 24 per cent had one child in 2000 compared with 21 per cent in 1990 (Table 6). For women aged 40–49 who were likely to have completed child-bearing, the proportion with one child also increased, from 11 per cent in 1990 to 15 per cent in 2000.
|
TABLE 6 |
RESIDENT EVER-MARRIED FEMALES AGED 15 YEARS AND OVER BY NUMBER OF CHILDREN BORN AND AGE GROUP |
Per Cent
|
Number of Children |
Total |
Below 30 |
30–39 |
40–49 |
50 & Over |
|||||
|
1990 |
2000 |
1990 |
2000 |
1990 |
2000 |
1990 |
2000 |
1990 |
2000 |
|
|
|
|
|
|
|
|
|
|
|
|
|
|
Total |
100.0 |
100.0 |
100.0 |
100.0 |
100.0 |
100.0 |
100.0 |
100.0 |
100.0 |
100.0 |
|
|
|
|
|
|
|
|
|
|
|
|
|
None |
11.5 |
11.7 |
38.1 |
47.3 |
11.0 |
14.2 |
4.7 |
6.4 |
3.5 |
3.2 |
|
1 |
16.2 |
16.6 |
33.3 |
30.7 |
20.9 |
23.6 |
10.5 |
15.1 |
7.0 |
8.4 |
|
2 |
27.2 |
31.2 |
22.1 |
17.1 |
41.4 |
39.1 |
32.2 |
42.0 |
12.9 |
21.3 |
|
3 |
18.0 |
20.3 |
5.5 |
4.1 |
20.9 |
18.1 |
28.3 |
27.4 |
14.8 |
21.4 |
|
4 |
9.2 |
8.4 |
0.8 |
0.8 |
4.5 |
4.1 |
14.1 |
7.0 |
14.6 |
14.8 |
|
5 & Over |
17.9 |
11.9 |
0.2 |
0.1 |
1.2 |
0.9 |
10.2 |
2.0 |
47.2 |
31.0 |
|
|
|
|
|
|
|
|
|
|
|
|
|
Average Number of Children |
2.8 |
2.5 |
1.0 |
0.8 |
1.9 |
1.8 |
2.8 |
2.2 |
4.7 |
3.9 |
|
|
|
|
|
|
|
|
|
|
|
|
Smaller Family Sizes for All Ethnic Groups
The average family size declined for all ethnic groups in the last ten years (Table 7). Of the three main ethnic groups, the Chinese had the smallest family size in 2000. For the age group 40–49 years, the Chinese had only 2.1 children compared with 2.8 for the Malays in 2000. The difference was similar for age group 30–39. The Chinese had 1.6 children as compared with 2.4 children for the Malays.
|
TABLE 7 |
AVERAGE NUMBER OF CHILDREN BORN BY ETHNIC GROUP AND AGE GROUP OF RESIDENT EVER-MARRIED FEMALES |
Age Group |
Chinese |
Malays |
Indians |
Others |
||||
|
1990 |
2000 |
1990 |
2000 |
1990 |
2000 |
1990 |
2000 |
|
Total |
2.8 |
2.5 |
3.2 |
3.1 |
2.7 |
2.4 |
2.3 |
2.0 |
|
|
|
|
|
|
|
|
|
|
Below 30 |
0.9 |
0.6 |
1.3 |
1.4 |
1.1 |
1.0 |
0.9 |
1.0 |
30 – 39 |
1.8 |
1.6 |
2.4 |
2.4 |
2.0 |
1.9 |
1.6 |
1.6 |
40 – 49 |
2.6 |
2.1 |
3.5 |
2.8 |
2.9 |
2.2 |
2.2 |
1.9 |
50 & Over |
4.5 |
3.7 |
5.9 |
4.9 |
4.7 |
3.9 |
3.7 |
3.0 |
|
|
|
|
|
|
|
|
|
|
Fewer Children among Better Educated Females
There was a strong correlation between family size and educational level of the females. On average, university graduates in all age groups have the fewest children (Table 8). For the age group 40–49 years in 2000, ever-married graduate females had 1.9 children compared with 2.4 children for those with below secondary qualifications. The fertility differential was larger among the younger females in their thirties – 1.3 children for the graduates as against 2.1 children for females with below secondary education. This was largely due to late marriage among the graduates.
|
TABLE 8 |
AVERAGE NUMBER OF CHILDREN BORN BY HIGHEST QUALIFICATION ATTAINED AND AGE GROUP OF RESIDENT EVER-MARRIED FEMALES |
Age Group |
Below |
Secondary |
Post |
University |
||||
|
1990 |
2000 |
1990 |
2000 |
1990 |
2000 |
1990 |
2000 |
|
Total |
3.4 |
3.3 |
1.6 |
1.9 |
1.5 |
1.5 |
1.4 |
1.3 |
|
|
|
|
|
|
|
|
|
|
Below 30 |
1.2 |
1.3 |
0.9 |
0.9 |
0.6 |
0.6 |
0.4 |
0.4 |
30 – 39 |
2.1 |
2.1 |
1.7 |
1.8 |
1.5 |
1.5 |
1.4 |
1.3 |
40 – 49 |
3.0 |
2.4 |
2.1 |
2.1 |
2.1 |
2.0 |
2.0 |
1.9 |
50 & Over |
4.8 |
4.2 |
3.0 |
2.5 |
2.8 |
2.3 |
2.5 |
2.2 |
|
|
|
|
|
|
|
|
|
|
Among females who had completed child-bearing, the university-educated had the highest proportion with no children or only one child. Some 10 per cent of the graduate females aged 40–49 years were childless in 2000, almost double the proportion for those with below secondary qualification (5.4 per cent) (Table 9). Another 19 per cent of the graduates in the same age group had only one child. Taken together, 28 per cent of the university-educated females were childless or had only one child. This was closely followed by those with post-secondary qualification (26 per cent) and secondary qualification (24 per cent).
|
TABLE 9 |
PROPORTION OF RESIDENT EVER-MARRIED FEMALES AGED 40–49 YEARS WITH NO CHILDREN OR ONE CHILD |
Per Cent
|
|
No Children |
One Child Only |
||
|
1990 |
2000 |
1990 |
2000 |
|
Total |
4.7 |
6.4 |
10.5 |
15.1 |
|
|
|
|
|
|
Below Secondary |
4.1 |
5.4 |
8.7 |
12.6 |
Secondary |
6.4 |
6.6 |
15.9 |
17.2 |
Post Secondary |
6.1 |
8.0 |
15.2 |
18.4 |
University |
7.8 |
9.4 |
15.9 |
18.6 |
|
|
|
|
|
|
CENSUS OF POPULATION OFFICE
SINGAPORE DEPARTMENT OF STATISTICS
FEBRUARY 2001