 Graph 1
Singapore Government Press Release
Media Division, Ministry of Information and The Arts,
36th Storey, PSA Building, 460 Alexandra Road, Singapore 119963.
Tel: 3757794/5
____________________________________________________________
MINISTRY OF HEALTH PRESS RELEASE
NATIONAL HEALTH SURVEY 1998
HIGHLIGHTS OF DATA ON SMOKING
Following the press conference by the National Smoking Control Committee on 10 May, we attach data on smoking obtained from the National Health Survey 98 for your use.
Secretariat, Committee on Smoking Control
Epidemiology & Disease Control Department
Ministry of Health
11 May 99
******************************************************************************
Trends in Smoking
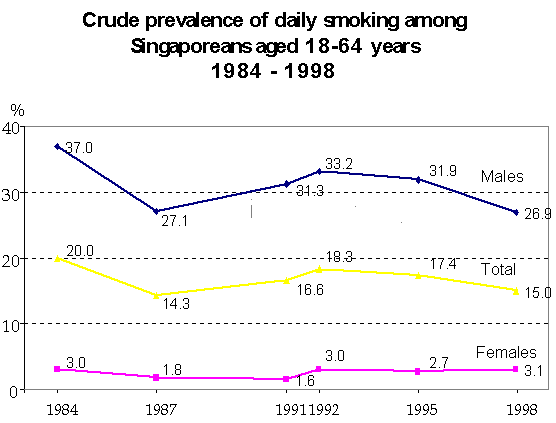
1 Since the start of the National Smoking Control Programme in 1986, there has been an overall decrease in smoking prevalence from 20% in 1984 to 15% in 1998. The proportion of Singaporeans who were daily smokers fell significantly from 18.3% in 1992 to 15.0% in 1998. More males (26.9%) than females (3.1%) smoked daily.
Prevalence of Smoking by Gender
2 The smoking prevalence among males aged 18-64 years declined from 37.0% in 1984 to 26.9% in 1998. While the smoking prevalence among males aged 18-64 years has decreased from 33.2% in 1992 to 26.9% in 1998, the smoking prevalence among females has remained the same (3.0% in 1992 and 3.1% in 1998). (Table 1 & Graph 1).
3 There has been no statistically significant change in the overall female smoking prevalence over the period from 1984 to 1998 (between 2-3%). Of concern is the increase in smoking prevalence among young women aged 20-24 years (2.5% in 1992 and 6.7% in 1998). The increase in smoking among women has also been observed in other developed countries.
Table 1. Smoking Status Of Singaporeans Aged 18-64 Years, 1998
| Smoking Status | Males |
Females |
Total |
| Daily Smoker | 26.9% |
3.1% |
15.0% |
| Occasional Smoker | 3.2% |
1.0% |
2.1% |
| Ex-Smoker | 9.9% |
0.7% |
5.3% |
| Non-Smoker | 60.0% |
95.2% |
77.6% |
Definitions of Smoking Status (World Health Organisation):
| Regular Smoker | - | Smokes at least one cigarette a day |
| Occasional Smoker | - | Smokes cigarettes but not every day |
| Ex-Smoker | - | Smoked at least one cigarette a day for at least six months before giving up completely |
| Non-Smoker | - | Never smoked before or smoked too little in the past to be regarded as ex-smoker |
Graph 1
4 The overall smoking prevalence among Singaporeans is relatively low and is lower than the rates in Vietnam, China, United Kingdom, Canada, United States and Sweden. (Table 2)
Table 2: International Comparison – Smoking Rates In Selected Countries, 1996-1998
Country |
Male (%) |
Female (%) |
All (%) |
Vietnam |
73 |
4 |
- |
People’s Republic of China |
63 |
4 |
- |
United Kingdom |
29 |
28 |
- |
Canada |
27 |
23 |
25 |
United States of America |
26 |
21 |
23 |
Sweden |
17 |
22 |
20 |
Hong Kong |
27 |
3 |
15 |
Singapore |
27 |
3 |
15 |
Smoking Prevalence by Age Group (Table 3)
5 Among the older age group (45-64 years), the smoking prevalence has decreased from 27.7% in 1984 to 14.8% in 1998. The smoking rate among males in this age group decreased from 47.1% in 1984 to 31.5% in 1992 and further decreased to 27.0% in 1998. The smoking rate among females in those aged 45-64 also showed a similar trend, decreasing from 8.0% in 1984 to 2.5% in 1998.
Table 3 : Age-specific prevalence (%) of daily smoking by gender, 1998
| Age (years) |
Males |
Females |
Total |
|||
1992 |
1998 |
1992 |
1998 |
1992 |
1998 |
|
| 18-19 | 26.0 |
20.0 |
3.6 |
3.7 |
15.2 |
12.2 |
| 20-24 | 30.1 |
27.7 |
2.5 |
6.7 |
16.5 |
17.2 |
18-24 |
29.0 |
25.5 |
2.8 |
5.9 |
16.1 |
15.8 |
25-44 |
35.2 |
27.2 |
2.4 |
2.6 |
19.0 |
15.0 |
45-64 |
31.5 |
27.0 |
4.7 |
2.5 |
18.1 |
14.8 |
18-64 |
33.2 |
26.9 |
3.0 |
3.1 |
18.3 |
15.0 |
6 While we have succeeded in getting older Singaporeans to stop smoking, the problem of smoking among teenagers and young adults (aged 18-24 years) is still of concern. The smoking prevalence among persons aged 20-24 years has increased from 16.5% in 1992 to 17.2% in 1998. The trend also appears to be stabilising for the younger age group, i.e. 18-19 years. The smoking prevalence for this age group was 15.2% for 1992 and 12.2% for 1995 and 1998. An increase in smoking among young people, especially among young women in recent years has also been observed in the USA and many European countries.
Prevalence of Regular Smoking By Ethnic Group
7 The smoking prevalence was most prevalent among Malay males (43.3%) compared to Chinese males (24.0%) and Indian males (29.9%) (Table 4). The smoking rates for Malay and Chinese males decreased significantly between 1992 and 1998. Among Malay males, the smoking rate decreased from 56% in 1992 to 43.3% in 1998. The smoking rate among Chinese males fell from 30.0% in 1992 to 24.0% in 1998. The smoking rate among Indian males remained fairly stable between 1992 (27.8%) and 1998 (29.9%).
8 Among females, the rates were 3.4%, 3.2% and 0.9% for Malay, Chinese and Indians, respectively. The smoking rates were not significantly different from that observed in 1992.
9 Of concern is the increasing trend of smoking among young women aged 18-24 years, especially among the Malays and Chinese. Among the Malays, the smoking rate in this group increased from 5.8% in 1992 to 12.8% in 1998. Among young Chinese females, the smoking rate increased from 2.3% in 1992 to 4.9% in 1998. The smoking rate among young Indian women remained at about 2% (2.0% in 1992 and 2.4% in 1998).
Table 4: Comparison of Daily Smoking Rates by Ethnic Groups and Gender, 1992 and 1998
18-64 years |
18-24 years |
|||
1992 |
1998 |
1992 |
1998 |
|
Males |
||||
Chinese |
30.0% |
24.0% |
24.3% |
22.7% |
Malay |
56.0% |
43.3% |
56.3% |
37.0% |
Indians |
27.8% |
29.9% |
24.4% |
31.0% |
All |
33.2% |
26.9% |
26.0% |
20.0% |
Females |
||||
Chinese |
2.7% |
3.2% |
2.3% |
4.9% |
Malay |
6.2% |
3.4% |
5.8% |
12.8% |
Indians |
0.7% |
0.9% |
2.0% |
2.4% |
All |
3.0% |
3.1% |
3.6% |
3.7% |
| Total | ||||
Chinese |
16.4% |
13.6% |
13.5% |
14.1% |
Malay |
31.3% |
23.5% |
31.8% |
25.5% |
Indians |
15.0% |
15.9% |
13.5% |
16.0% |
All |
18.3% |
15.0% |
15.2% |
12.2% |
Prevalence of Regular Smoking By Educational Level
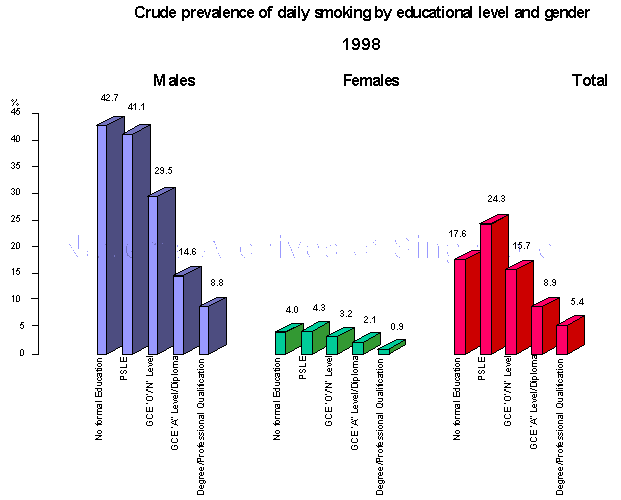
10 The smoking habit was inversely correlated to educational level in both males and females (Graph 2). Those with PSLE or lower education were more likely to smoke than graduates.
 Graph 2
Prevalence of Regular Smoking By Activity Status
11 Among male smokers aged 18-24 years, about 42% were working, 23% were students while 6% were unemployed. Among female smokers aged 18-24 years, about 80% were working, 13% were students and 6% were unemployed at the time surveyed.
Prevalence of Regular Smoking By Major Occupational Group
12 Smoking was least prevalent among professionals in both males (5.1%) and females (1.3%).
13 Among males, smoking was most prevalent among unskilled workers (50.8%). About 1 in 2 male unskilled workers smoked daily. Among females, smoking was most prevalent among service or sales workers (7.9%) followed by skilled workers (6.9%) and unskilled workers (4.7%).
Average Age of Starting
14 The average age at which young smokers aged 18-24 years old first experimented with smoking was 15 years. These young smokers established their smoking habit at the age of 17 years (Table 5).
Table 5: Average Age of Experimentation and Regular Smoking by Gender
Males |
Females |
Total |
||||||
1992 |
1998 |
1992 |
1998 |
1992 |
1998 |
|||
| Average age of experimentation (yrs) | 15 |
15 |
16 |
14 |
15 |
15 |
||
| Average onset age of daily smoking (yrs) | 16 |
17 |
17 |
17 |
16 |
17 |
||
Reasons for Smoking
15 The most common reasons given by young smokers for smoking regularly was to relieve stress or for relaxation (Tables 6a -c).
Table 6: Main Reasons why Singaporeans smoke daily
a) Aged 18-19 years %
| Reasons | Males |
Females |
Total |
|||||
1995 |
1998 |
1995 |
1998 |
1995 |
1998 |
|||
| To relax/relieve stress | 33.6 |
31.8 |
29.3 |
62.2 |
30.4 |
36.3 |
||
| Unbearable if don’t smoke/cannot concentrate without smoking | 40.9 |
28.5 |
45.4 |
12.2 |
39.5 |
26.1 |
||
| Peer pressure | 2.5 |
22.1 |
0.9 |
25.5 |
2.6 |
22.6 |
||
| Smoking is enjoyable | 7.6 |
14.3 |
0.0 |
0.0 |
6.2 |
12.2 |
||
| Boredom | 0.0 |
3.2 |
7.8 |
0.0 |
6.0 |
2.8 |
||
b) Aged 18-24 years %
| Reasons | Males |
Females |
Total |
|||||
1995 |
1998 |
1995 |
1998 |
1995 |
1998 |
|||
| To relax/relieve stress | 39.2 |
48.8 |
29.3 |
53.6 |
28.2 |
49.7 |
||
| Unbearable if don’t smoke/cannot concentrate without smoking | 39.5 |
22.2 |
45.4 |
29.9 |
9.3 |
23.6 |
||
| Peer pressure | 1.4 |
10.8 |
0.9 |
8.0 |
1.4 |
10.3 |
||
| Smoking is enjoyable | 5.6 |
7.3 |
0.0 |
4.8 |
5.0 |
6.8 |
||
| Boredom | 7.6 |
7.0 |
7.8 |
3.7 |
7.6 |
6.4 |
||
c) Aged 18-64 years %
Reasons |
Males |
Females |
Total |
|||||
1995 |
1998 |
1995 |
1998 |
1995 |
1998 |
|||
To relax/relieve stress |
28.4 |
35.3 |
34.4 |
43.2 |
28.8 |
36.1 |
||
Unbearable if don’t smoke/cannot concentrate without smoking |
42.6 |
37.3 |
45.4 |
29.6 |
42.8 |
36.5 |
||
Peer pressure |
1.2 |
3.9 |
0.0 |
4.7 |
1.1 |
4.0 |
||
Smoking is enjoyable |
4.8 |
8.9 |
0.5 |
6.7 |
4.5 |
8.7 |
||
Boredom |
7.8 |
6.4 |
14.1 |
14.7 |
8.3 |
7.3 |
||
Number of Cigarettes Smoked and Monthly Expenses on Cigarettes
16 Overall, there was not much change in the number of sticks of cigarettes smoked per day and thus the amount spent on cigarettes per month in 1998 compared to 1992 (Tables 7 & 8).
Table 7: Average Number of Cigarettes Smoked Daily by Smokers
Age Group |
Males |
Females |
Total |
|||||
1992 |
1998 |
1992 |
1998 |
1992 |
1998 |
|||
| 18-19 | 12 |
8 |
10 |
7 |
11 |
8 |
||
| 20-24 | 12 |
11 |
10 |
8 |
12 |
10 |
||
| 18-24 | 12 |
10 |
9 |
8 |
12 |
10 |
||
| 25-44 | 16 |
15 |
11 |
9 |
15 |
14 |
||
| 45-64 | 16 |
16 |
11 |
8 |
15 |
15 |
||
| 18-64 | 15 |
14 |
10 |
8 |
15 |
14 |
||
Table 8: Average Monthly Expenses Spent on Cigarettes
Males |
Females |
Total |
||||||
| Age Group | 1992 |
1998 |
1992 |
1998 |
1992 |
1998 |
||
| 18-19 | $92 |
$72 |
$78 |
$47 |
$89 |
$68 |
||
| 20-24 | $91 |
$88 |
$94 |
$63 |
$92 |
$96 |
||
| 18-24 | $91 |
$84 |
$89 |
$61 |
$91 |
$80 |
||
| 25-44 | - |
$124 |
- |
$74 |
- |
$120 |
||
| 45-64 | - |
$128 |
- |
$50 |
- |
$121 |
||
| 18-64 | $114 |
$120 |
$92 |
$64 |
$113 |
$114 |
||
Prevalence of Smoking Cessation
17 The prevalence of smoking cessation (i.e. ex-smokers / ever smokers) remained fairly similar for 1992 (23.1%) and 1998 (25.6%). Smoking cessation was higher among male smokers (26.5%) than female smokers (17.3%).
18 Smoking cessation was positively correlated to the age of the smoker. The older smokers (aged 55-64 years) were more likely to stop smoking than the younger smokers (18-24 years) (44.7% vs 10.6%).
19 Smoking cessation was highest among those with university degrees or professional qualifications (41.3%).
20 The main reasons for quitting smoking among the different age-groups are shown in Table 9.
Table 9: Main Reason for Quitting Smoking
Reason |
Age Group (years) |
|||
20-24 |
25-44 |
45-64 |
18-64 |
|
Health reasons |
16.7 |
19.5 |
35.9 |
28.1 |
Pressure from family, friends or colleagues |
39.6 |
15.3 |
14.9 |
16.4 |
Learnt about ill effects of smoking |
16.6 |
19.5 |
12.5 |
15.6 |
Advised to stop smoking by doctor |
9.0 |
2.6 |
7.4 |
5.4 |
No particular reason |
18.3 |
25.4 |
14.8 |
19.3 |